Project
Visualisations for knowledge transfer in climate adaptation planning
Climate change will affect several land use related sectors and therefore spatial planning in general. There is a growing sense that, especially at the local scale, spatial planning has a key role in addressing the causes and impacts of climate change. Spatial planning decisions can effect vulnerability and resilience to climate change impacts. Visualisations, particularly maps, have proven to be powerful tools in the process of spatial planning, since maps clearly visualise the complexity of different spatial demands. Also in the decision making process visual representations can enhance a decision maker’s capability to effectively evaluate information.
This research investigates how visualisations can contribute to knowledge transfer in climate adaptation planning. The main research question reads:
How can we translate scientific information on climate change impacts into policy-relevant and usable information to support local adaptation planning?
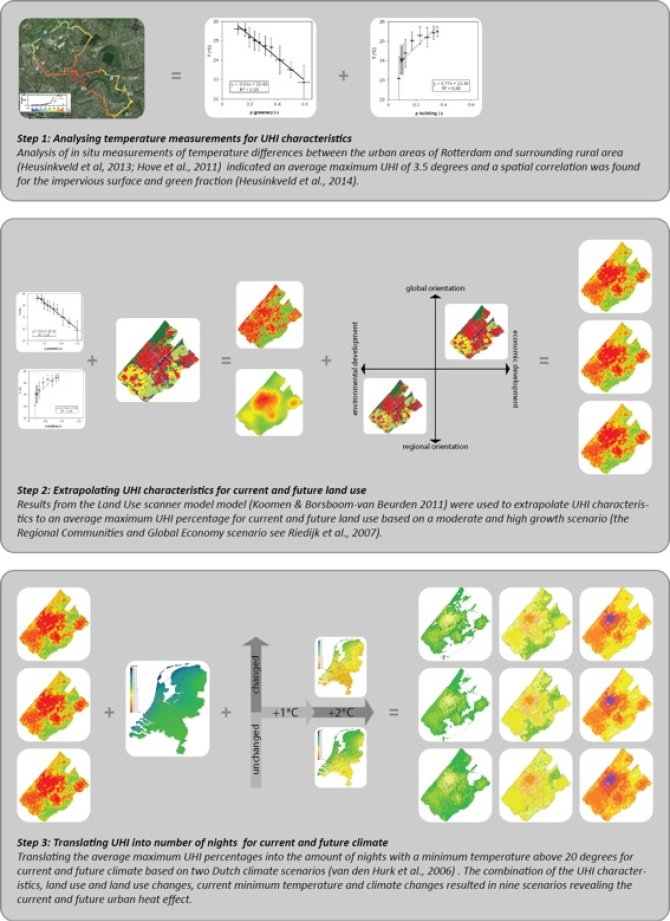
To address the research question both indicators (what to visualise) and visualisation techniques (how to visualise) are subject of study. The development and evaluation of indicators and visualisation techniques take place in close cooperation with policy makers of different case study areas. The visualisations are limited to the traditional cartography of orthogonal projections, focusing on different techniques as map types, graphic variables and map presentation. Aim of the project is to develop a theoretical framework that links visualisation techniques to the information and communication needs of policy makers in specific adaptation planning situations.
